The INR formula is deceptively simple — three numbers combined using an exponent. Yet understanding exactly what each component represents and why the formula was designed this way unlocks a much deeper understanding of coagulation testing, reagent variability, and inter-laboratory standardisation.
This article breaks down the INR formula component by component, explains the role of the ISI, and walks through worked examples so that the calculation becomes intuitive rather than mechanical.
Learning Objectives
- State the INR formula and identify each component
- Explain what PTpatient, PTmean normal, and ISI each represent
- Calculate INR from given PT and ISI values
- Explain why two labs with different ISI values produce the same INR for the same patient
- Explain why ISI is used as an exponent rather than a multiplier
- Identify common calculation mistakes and how to avoid them
The INR Formula
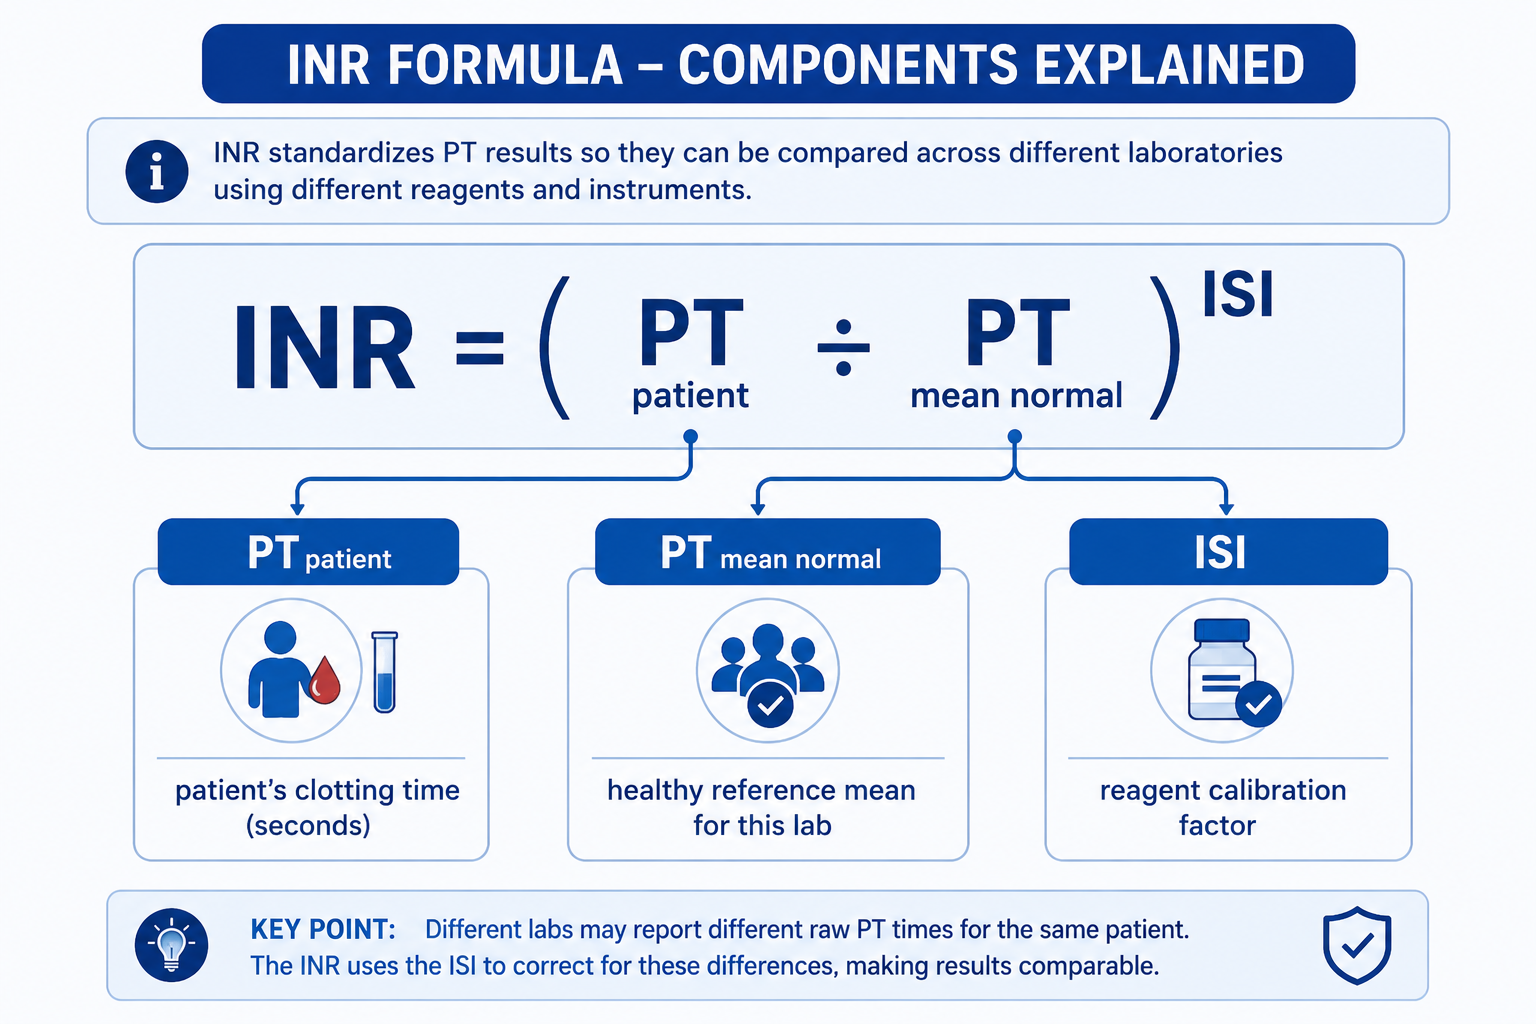
This is the formula adopted by the World Health Organization and used universally in laboratories worldwide. Each of the three components plays a specific and necessary role.
Step 1: PT ratio = PTpatient ÷ PTmean normal
Step 2: INR = PT ratio raised to the power of ISI
Do not calculate:
- INR = PT × ISI
- INR = PT ratio × ISI
- INR = PTpatient ÷ ISI
Explaining Each Component
1. PTpatient — The Patient's Clotting Time
This is the raw prothrombin time of the patient's plasma sample, measured in seconds using the laboratory's thromboplastin reagent and calcium. A normal individual clots in roughly 11–14 seconds; a patient on warfarin may clot in 20–30+ seconds depending on their degree of anticoagulation.
On its own, this number cannot be compared between laboratories because different reagents produce different absolute PT values for the same patient. This is the problem the rest of the formula solves.
2. PTmean normal — The Laboratory's Reference Mean
This is the mean PT (geometric mean) of a reference population of healthy, non-anticoagulated individuals tested with the same reagent in the same laboratory. It is established by each laboratory during reagent validation.
Dividing PTpatient by PTmean normal gives the PT ratio — a dimensionless number expressing how much longer the patient's clotting time is relative to a normal individual at that laboratory. A PT ratio of 1.0 is normal; a ratio of 2.0 means the patient's blood takes twice as long to clot as the average healthy person.
The PT ratio still varies between laboratories because different reagents produce different raw PT values. The ISI correction step addresses this.
3. ISI — International Sensitivity Index
The ISI is a calibration factor assigned to each thromboplastin reagent by the manufacturer. It quantifies how sensitive that reagent is to reductions in vitamin K-dependent clotting factors, relative to the WHO International Reference Preparation (which has an ISI of exactly 1.0).
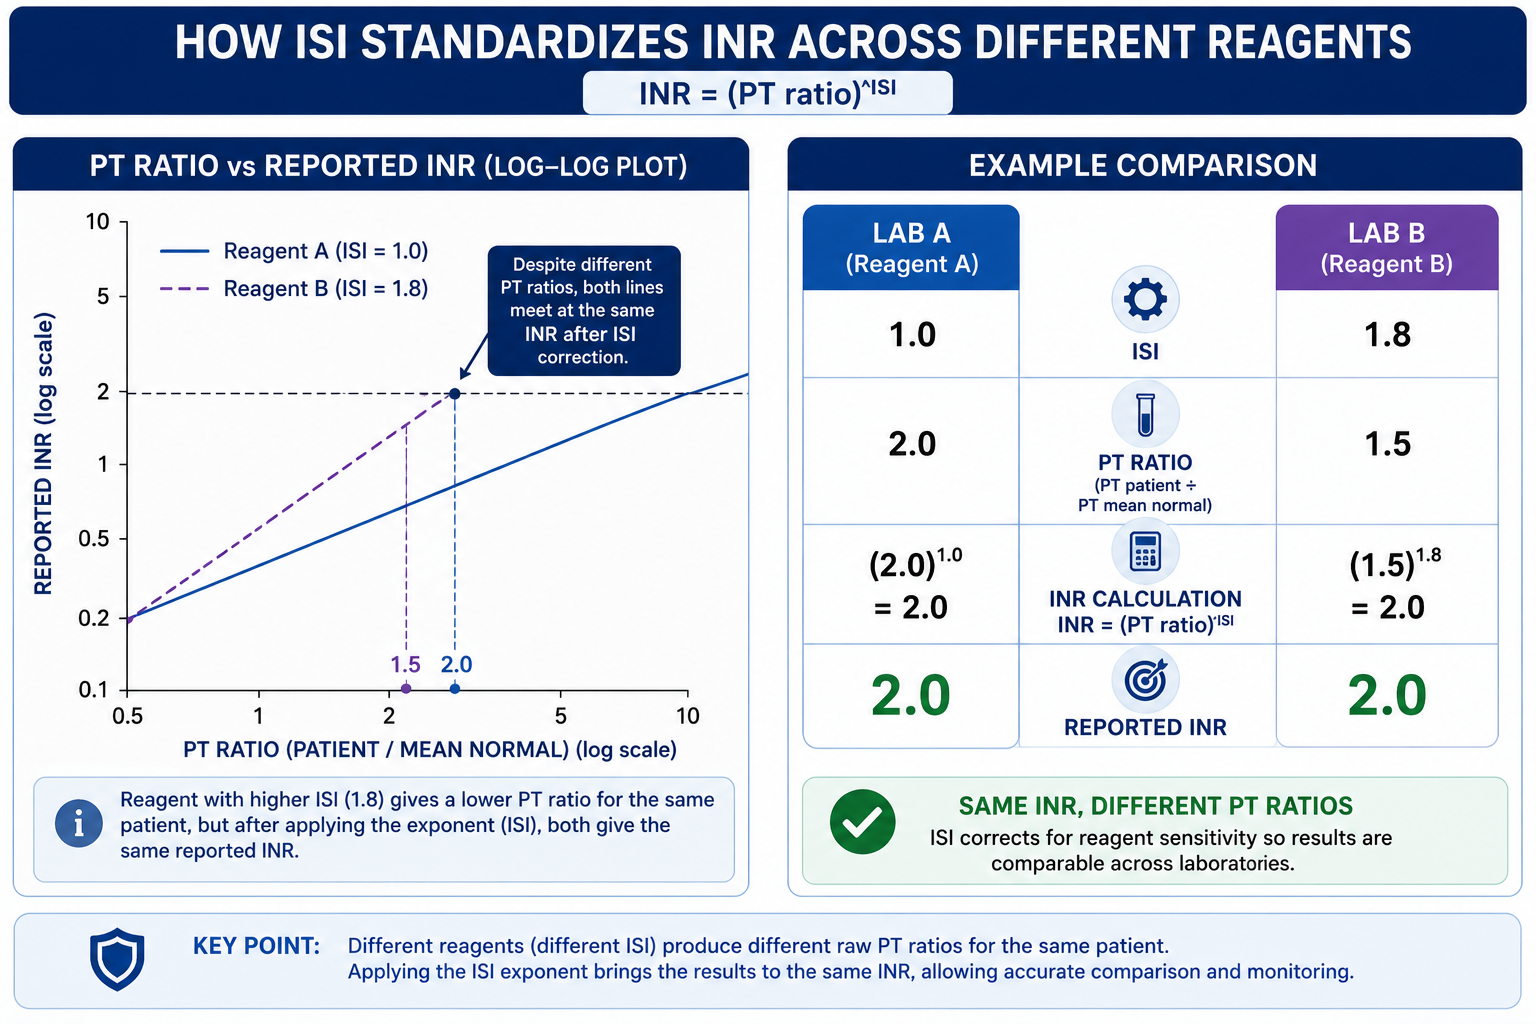
By raising the PT ratio to the power of the ISI, the formula corrects for the reagent's sensitivity characteristics. A less sensitive reagent (high ISI) produces a smaller PT ratio than a sensitive reagent (low ISI) for the same degree of anticoagulation — but the ISI exponent amplifies the less sensitive reagent's ratio to compensate, producing an equivalent INR.
The ISI only matters for the calculation. Clinicians do not need to know a laboratory's ISI to interpret INR results — the lab applies it automatically. The ISI is the laboratory's internal calibration parameter; the INR is the standardised result the clinician receives.
Why Is ISI Used as an Exponent?
At first glance, the INR formula looks unusual because the ISI is used as an exponent rather than as a simple multiplier. This reflects how thromboplastin reagents are calibrated.
When PT ratios produced by a commercial thromboplastin reagent are compared with PT ratios produced by the WHO International Reference Preparation, the relationship is assessed on a logarithmic scale. On this log-log comparison, the slope of the calibration line is the International Sensitivity Index. Because of this mathematical relationship, the correction is applied by raising the PT ratio to the power of the ISI — not by multiplying.
This is why INR is not calculated as PT ratio × ISI. The exponent converts the local PT ratio into an internationally standardised value in a way that matches the underlying log-log calibration relationship.
INR = PT ratio only when ISI is exactly 1.0. When ISI is not 1.0, the PT ratio must be raised to the power of ISI to obtain the INR. This is the most commonly tested distinction in this topic.
Worked Examples
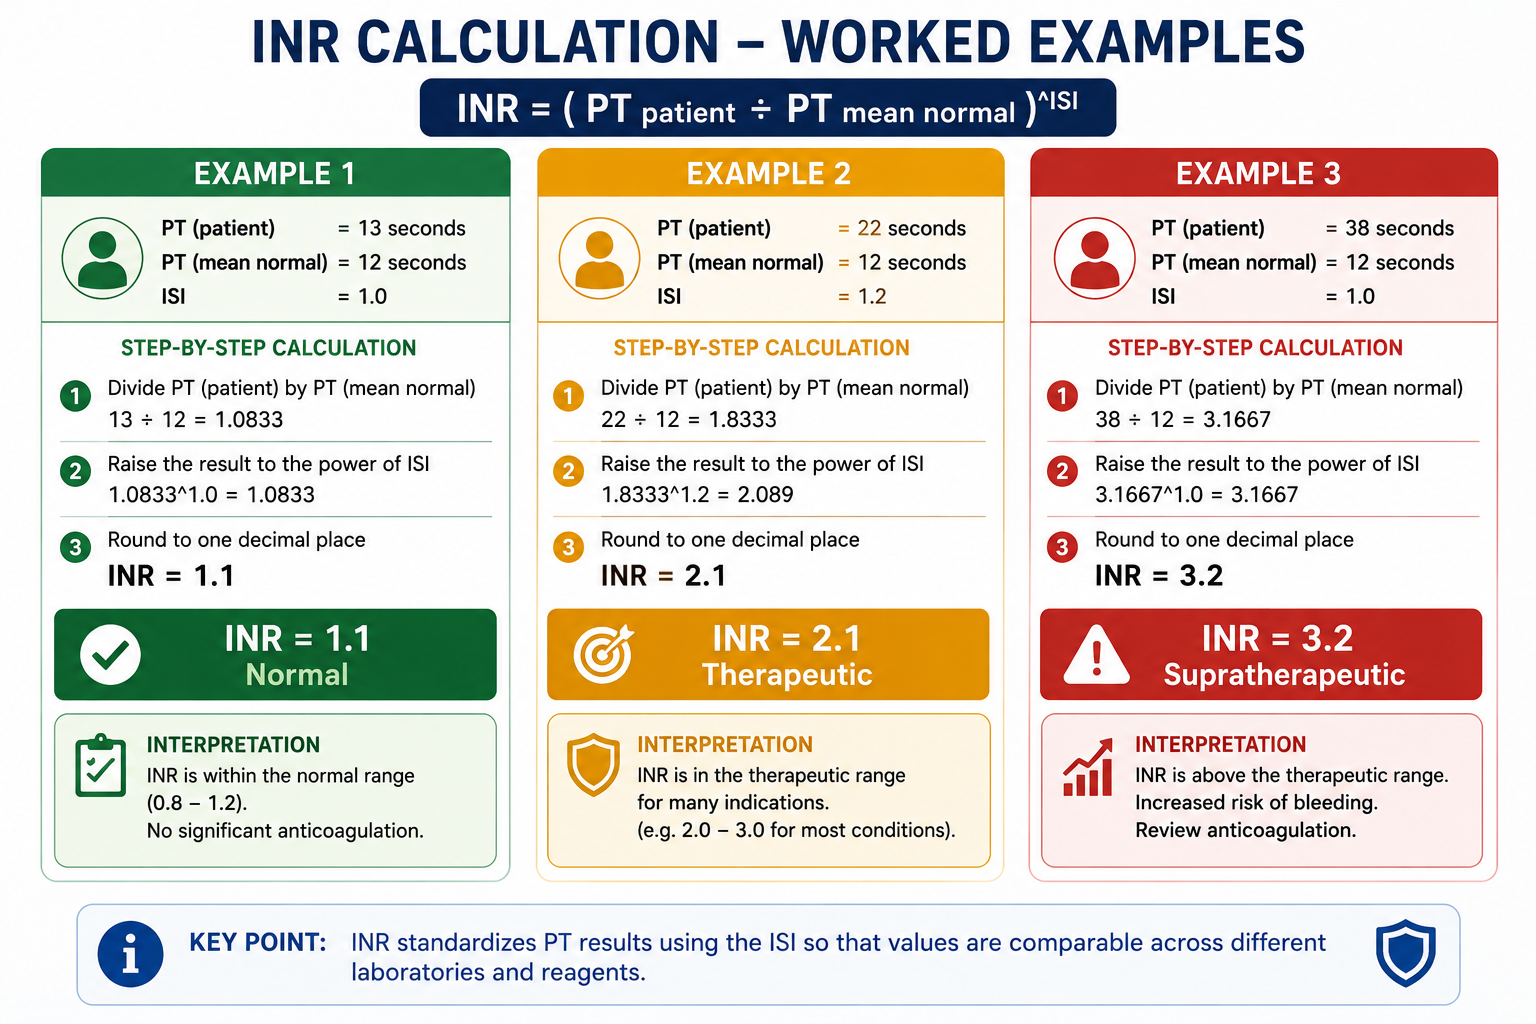
Example 1 — Normal INR
Example 2 — Therapeutic INR (warfarin patient)
Example 3 — Supratherapeutic INR
Example 4 — Why ISI Matters: Same Patient, Two Labs
This example demonstrates the core purpose of the ISI — producing the same INR result even when two laboratories use different reagents.
| Laboratory A | Laboratory B | |
|---|---|---|
| Reagent ISI | 1.0 (highly sensitive) | 1.8 (less sensitive) |
| PTmean normal | 12 s | 12 s |
| PTpatient | 24 s | 18 s |
| PT ratio | 24 ÷ 12 = 2.0 | 18 ÷ 12 = 1.5 |
| INR | 2.01.0 = 2.0 | 1.51.8 = 2.0 |
Both laboratories report an INR of 2.0 for the same patient, despite measuring very different raw PT values. The ISI correction normalises these differences — this is the entire purpose of the INR system.
Clinical Context: Calculation Is Not the Same as Interpretation
This article explains how INR is calculated. Clinical interpretation depends on the situation.
An INR of 2.5 may be therapeutic in a patient receiving warfarin for atrial fibrillation, but abnormal in a patient who is not receiving anticoagulation. In procedural, trauma, liver disease, and critical care settings, even moderate INR elevation may be clinically important.
Therefore, avoid interpreting INR from the number alone. Always consider the indication, medication history, liver function, bleeding history, planned procedures, platelet count, fibrinogen, and full clinical context.
INR is also used in liver disease severity scoring systems such as Child-Pugh and MELD, where it reflects hepatic synthetic function rather than warfarin intensity.
For broader interpretation, causes of prolonged PT/INR, warfarin monitoring targets, and full clinical meaning, see PT and INR Explained.
Common Calculation Mistakes
These errors occur frequently in exam contexts and should be avoided:
- Using PTpatient in seconds as if it were the INR — PT in seconds is not a standardised value
- Forgetting to divide PTpatient by the laboratory mean normal PT — skipping this gives an uncorrected time, not a ratio
- Treating PT ratio as INR when ISI is not 1.0 — valid only when ISI = 1.0
- Multiplying PT ratio by ISI instead of raising it to the power of ISI — the most common arithmetic error
- Rounding the PT ratio too early before applying the ISI exponent — this compounds rounding error in the final result
- Comparing raw PT values between different laboratories — raw PT is reagent-dependent and not comparable; INR must be used
Calculate the PT ratio first (PTpatient ÷ PTmean normal), carry the full decimal, then raise that ratio to the power of ISI. Do not round until the final step.
Why Laboratories Use INR Instead of PT Ratio
The PT ratio alone would be sufficient if all laboratories used identical thromboplastin reagents with the same sensitivity — but they do not. Commercial reagents are sourced from different manufacturers, derived from different tissues, and have been processed in different ways, all of which affect their ISI.
Before the INR system was introduced, studies showed that a patient on stable warfarin therapy could have a "PT ratio" of 1.5 at one hospital and 2.5 at another — purely because of reagent differences. Warfarin dose adjustments based on raw PT data were therefore unreliable and potentially dangerous.
The INR system solved this by anchoring all results to the WHO reference reagent. A laboratory with a high-ISI reagent that tends to under-report anticoagulation severity has its results amplified by the ISI exponent; a low-ISI reagent that is overly sensitive has its results attenuated. The end result is a common language for coagulation across the world.
INR of 2.5 means the same thing in a district hospital in Sri Lanka as it does in a tertiary centre in the UK — because both laboratories calibrate their reagents against the same WHO reference. This is the practical value of the formula's ISI correction step.
Common Misconceptions
INR equals the PT ratio only when ISI = 1.0. Most commercial reagents have ISI values between 1.0 and 2.0. A reagent with ISI = 1.5 producing a PT ratio of 2.0 gives INR = 2.01.5 = 2.83 — not 2.0. These are meaningfully different clinical values.
Even if two labs produce numerically similar raw PT values for a patient, the ISI of their reagents may differ — meaning the INR values they report may still differ. Always compare INR values, not raw PT values, across institutions.
A lower ISI indicates a more sensitive reagent, which reduces mathematical amplification in the formula and produces more precise INR values. However, "better" depends on the clinical use. For warfarin monitoring, a reagent with ISI close to 1.0 is preferred as it minimises amplification of PT ratio variability. For non-warfarin coagulopathies, reagent choice is less critical as long as it is validated for the intended purpose.
Exam Tips
- Know the formula by heart: INR = (PTpatient / PTmean normal)ISI
- PT ratio = PTpatient / PTmean normal — a stepping stone to INR, not the final answer.
- ISI of the WHO reference preparation = 1.0 — this is the anchor of the whole system.
- When ISI = 1.0, INR = PT ratio — the only scenario where they coincide.
- Higher ISI means less sensitive reagent → the exponent amplifies the PT ratio more to compensate.
- INR is dimensionless — it has no units. PT is measured in seconds; INR is a ratio.
- Exam questions may give you a PT and ISI and ask you to calculate INR — practice with the worked examples above until the arithmetic feels natural.
Frequently Asked Questions
Key Takeaways
- INR = (PTpatient ÷ PTmean normal)ISI — the fundamental formula
- PTmean normal is the geometric mean PT of healthy controls using the same reagent and lab
- ISI calibrates for reagent sensitivity relative to the WHO reference preparation (ISI = 1.0)
- PT ratio = PTpatient / PTmean normal — this is the intermediate step, not the final answer
- INR = PT ratio only when ISI = 1.0; otherwise PT ratio must be raised to the power of ISI
- ISI is an exponent because thromboplastin calibration uses a log-log relationship — multiplication is incorrect
- The ISI exponent corrects for inter-laboratory reagent differences, producing a standardised result
- Lower ISI reagents are preferred for warfarin monitoring — they produce more precise INR values with less amplification of measurement error
- Calculation ≠ interpretation: INR of 2.5 means different things in different clinical contexts — always interpret in full clinical context
- Common mistake: multiplying PT ratio × ISI instead of raising PT ratio to the power of ISI
References
- WHO Expert Committee on Biological Standardization. Guidelines for thromboplastins and plasma used to control oral anticoagulant therapy. WHO Technical Report Series No. 889. Geneva: WHO; 1999.
- van den Besselaar AMHP. Accuracy, precision and quality control for point-of-care testing of oral anticoagulation. J Thromb Thrombolysis. 2001;12(1):35–40.
- Poller L, et al. A multicentre calibration of laboratory INR: a pilot study. Br J Haematol. 1998;101(3):476–481.
- Horsti J, Uppa H, Vilpo JA. Poor agreement among prothrombin time international normalized ratio methods. Clin Chem. 2005;51(3):553–560.
- Favaloro EJ, Lippi G. Laboratory hemostasis: from biology to the bench. Clin Chem Lab Med. 2018;56(7):1118–1130.
This article is intended for medical education only. It does not constitute clinical advice. Always refer to current local guidelines and specialist input for clinical decision-making regarding coagulation testing and management.