The Model for End-Stage Liver Disease (MELD) is the primary tool used internationally to prioritise patients with chronic liver disease for liver transplantation. Unlike the Child-Pugh score, MELD is fully objective — it relies entirely on measurable laboratory values with no subjective clinical assessments.
Originally developed to predict 3-month mortality after a specific liver procedure, MELD has since been validated across a wide range of clinical contexts in hepatology. Understanding the formula, what each component measures, and how MELD is applied clinically is essential for any doctor working in medicine or gastroenterology.
The MELD score (Model for End-Stage Liver Disease) is an objective severity score used to estimate short-term mortality in chronic liver disease. It uses bilirubin, INR, and creatinine to generate a numerical score. Higher MELD scores indicate higher mortality risk and greater priority for liver transplantation. MELD is now the standard system used for transplant allocation in many countries.
Learning Objectives
- State the MELD formula and identify each of the three variables
- Explain why bilirubin, INR, and creatinine were chosen for the MELD formula
- Calculate a MELD score from given clinical data
- Interpret MELD score ranges in terms of 3-month mortality risk
- Describe the clinical applications of MELD, including transplant prioritisation
- Explain MELD-Na and why sodium was added
- Compare MELD with the Child-Pugh score and identify the strengths of each
Why MELD Was Developed
Before MELD, the Child-Pugh score was used to assess severity of liver disease and guide transplant decisions. However, Child-Pugh had significant limitations for transplant prioritisation: its subjective parameters introduced inconsistency, and it lacked any component reflecting renal function — a critical determinant of short-term mortality in decompensated cirrhosis.
In 2001, Kamath et al. at the Mayo Clinic developed the MELD score to predict 3-month mortality in patients undergoing transjugular intrahepatic portosystemic shunt (TIPS) procedures. They identified three objective laboratory values that best predicted mortality: bilirubin, INR, and creatinine — plus the aetiology of liver disease (alcoholic vs non-alcoholic).
In 2002, the United Network for Organ Sharing (UNOS) adapted MELD (removing the aetiology variable) to allocate livers for transplantation in the United States. This version — sometimes called the UNOS MELD — is now the internationally recognised standard and is used by most transplant programmes worldwide.
The MELD Formula
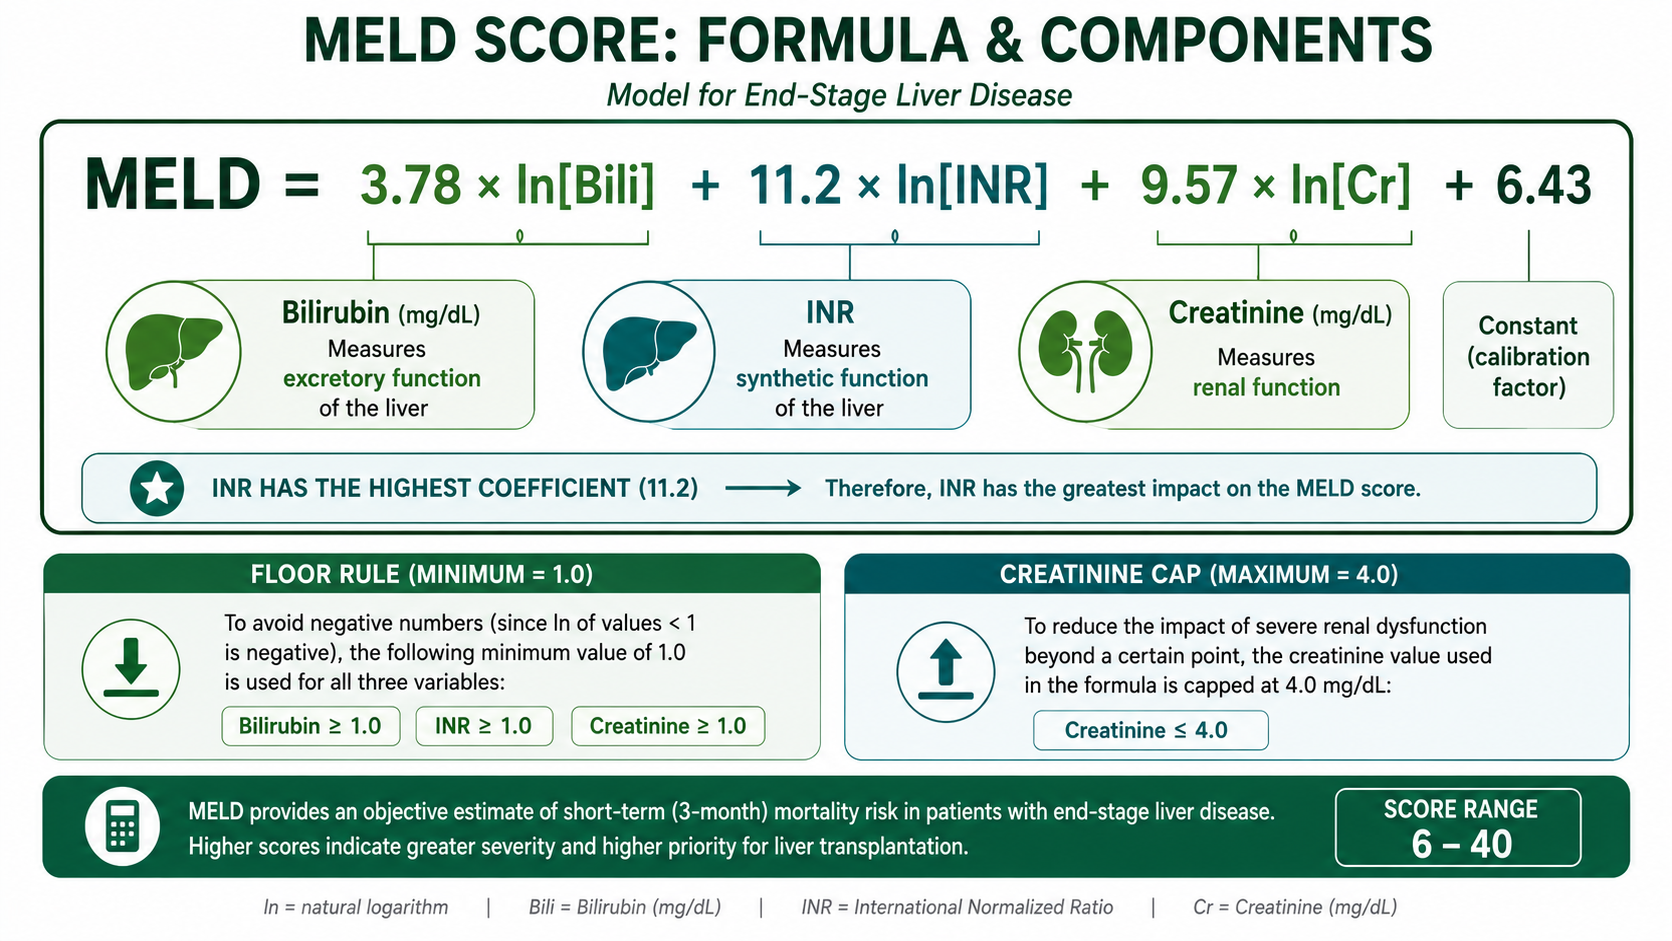
INR has the highest coefficient (11.2) because impaired hepatic synthetic function was the strongest laboratory predictor of short-term mortality in the original MELD derivation cohort. This means that a worsening INR often contributes more to MELD progression than equivalent changes in bilirubin or creatinine. For details on why INR reflects hepatic synthetic function, see PT and INR Explained.
- All values in mg/dL: Bilirubin (not μmol/L), Creatinine (not μmol/L). Convert if necessary.
- Minimum value for each variable = 1.0 mg/dL: If bilirubin, creatinine, or INR is < 1.0, set it to 1.0 before applying the logarithm (to avoid negative log values which would produce meaningless negative MELD scores).
- Maximum creatinine = 4.0 mg/dL: If the patient has been dialysed at least twice in the past week, creatinine is also set to 4.0 mg/dL.
- Round the final result to the nearest integer.
Why These Three Variables?
1. Bilirubin — Hepatic Excretory Function
Bilirubin (coefficient 3.78) reflects the liver's ability to excrete bile and metabolise haem breakdown products. A rising bilirubin indicates worsening hepatocellular function or biliary obstruction. In the context of cirrhosis, hyperbilirubinaemia is a marker of hepatic decompensation and correlates with mortality risk.
2. INR — Hepatic Synthetic Function
INR (coefficient 11.2 — the largest coefficient) reflects the liver's ability to synthesise clotting factors. A rising INR indicates falling hepatic synthetic reserve. INR responds quickly to changes in hepatic function (Factor VII half-life ~4–6 hours) and is a sensitive and early marker of hepatic decompensation. For why INR is used rather than raw PT, see PT and INR Explained.
3. Creatinine — Renal Function
Creatinine (coefficient 9.57) is the most impactful addition compared to the Child-Pugh score. Renal dysfunction in cirrhosis — particularly hepatorenal syndrome (HRS) — is one of the strongest independent predictors of short-term mortality. Creatinine captures this risk, which Child-Pugh does not. Including creatinine makes MELD substantially more accurate at predicting 3-month mortality in decompensated liver disease.
The MELD formula uses natural logarithm (ln) of each variable because the relationship between these laboratory values and mortality is non-linear — it follows a log-linear pattern. The logarithm transformation linearises this relationship, improving the model's statistical fit. It also means that small changes at very abnormal values (e.g. bilirubin rising from 10 to 15 mg/dL) contribute proportionally less to the MELD score than the same absolute change at lower values (e.g. 1.0 to 1.5 mg/dL), which reflects clinical reality.
Think of MELD as assessing three critical organ systems:
- Bilirubin → Bile excretion (hepatic excretory function)
- INR → Clotting factor synthesis (hepatic synthetic function)
- Creatinine → Kidney function (renal dysfunction in cirrhosis)
These three systems together provide a powerful estimate of short-term mortality in advanced liver disease. Memory aid: Bile — Clotting — Kidneys.
Worked Example
A 52-year-old with decompensated alcoholic cirrhosis. Bloods: Bilirubin = 4.5 mg/dL, INR = 2.1, Creatinine = 1.8 mg/dL
Interpretation of MELD Score Ranges
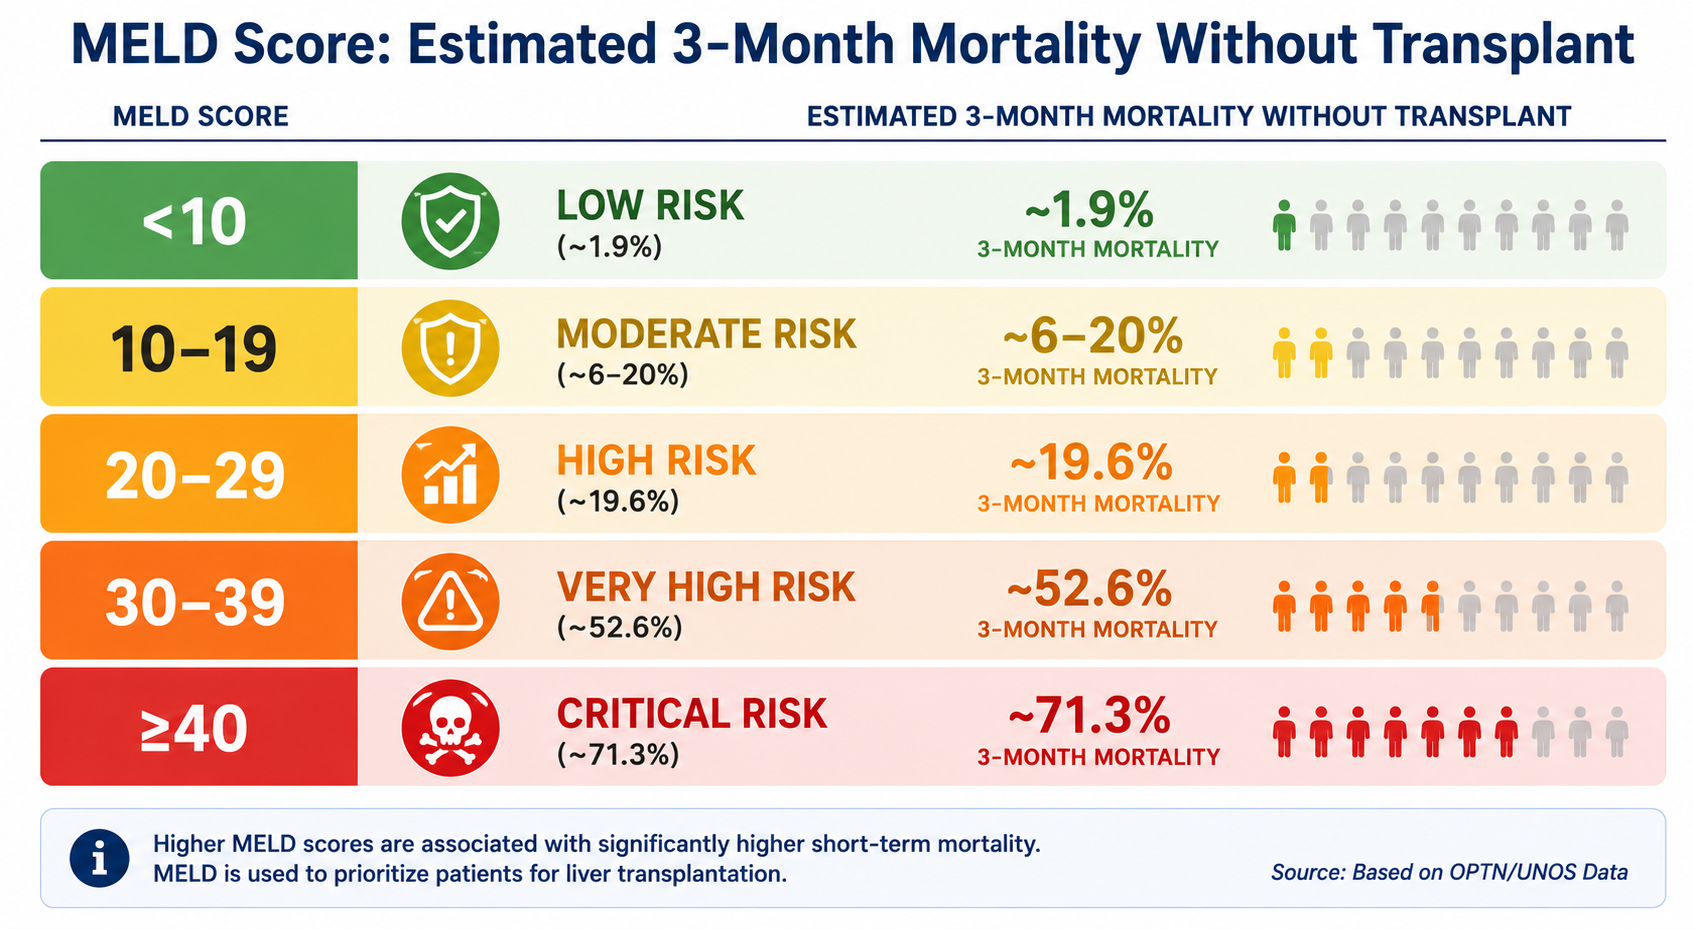
| MELD Score | Risk Category | Estimated 3-Month Mortality (without transplant) |
|---|---|---|
| <10 | Low | ~1.9% |
| 10–19 | Moderate | ~6–20% |
| 20–29 | High | ~19.6% |
| 30–39 | Very High | ~52.6% |
| ≥40 | Critical | ~71.3% |
MELD mortality estimates are derived from population-level data. Individual patient mortality depends on many factors not captured by MELD: cause of liver disease, comorbidities, response to treatment of acute complications, access to transplantation, and nutritional/functional status. MELD should inform clinical decisions — it should not replace clinical judgement.
Clinical Applications
1. Liver Transplant Waiting List Prioritisation
This is the primary clinical use of MELD. In most transplant systems (US, UK, Europe), organs are allocated to the sickest patients first — those with the highest MELD score, representing the highest short-term mortality without transplant. A higher MELD score means a higher position on the transplant waiting list.
This system replaced the previous time-based waiting list allocation, which disadvantaged patients who deteriorated rapidly. MELD ensures that the sickest patients (who would die soonest without a transplant) receive priority.
Exception points can be granted for specific conditions (e.g. hepatocellular carcinoma within Milan criteria) where MELD may underestimate mortality risk — these patients receive a calculated MELD equivalent based on their expected waitlist dropout rate.
2. Predicting Mortality After TIPS
The original application of MELD. A post-TIPS MELD > 18 is associated with high 3-month mortality; patients with MELD > 18 had poor outcomes from TIPS in the original derivation cohort.
3. Assessing Severity of Acute Decompensation
In acute decompensated cirrhosis (e.g. acute-on-chronic liver failure, ACLF), serial MELD measurements track the trajectory of disease. A rising MELD indicates deterioration; a falling MELD with treatment suggests recovery. MELD is used alongside ACLF grading systems (e.g. CANONIC criteria) in ICU settings.
4. Surgical Risk Assessment
MELD (or MELD combined with ASA class) can estimate peri-operative mortality. MELD > 15 is generally associated with prohibitive operative risk for major elective surgery. Many surgical societies incorporate MELD into peri-operative risk calculators for hepatic patients.
5. Relationship to HCC Staging
Although MELD is central to transplant prioritisation, hepatocellular carcinoma staging systems such as the Barcelona Clinic Liver Cancer (BCLC) classification continue to incorporate Child-Pugh class alongside tumour burden and performance status. This highlights the complementary roles of MELD and Child-Pugh in hepatology practice — MELD does not render Child-Pugh obsolete in all clinical contexts.
MELD-Na: Adding Sodium
Hyponatraemia (low serum sodium) is common in decompensated cirrhosis and is independently associated with poor prognosis — it reflects excessive neurohormonal activation (RAAS, ADH) trying to compensate for circulatory dysfunction. Despite this prognostic importance, sodium is not included in the original MELD formula.
MELD-Na was developed to correct this, adding serum sodium to improve prognostic accuracy:
MELD-Na increases the score for hyponatraemic patients (Na < 137), as these patients have worse prognosis than their MELD alone would suggest. In the US transplant system, MELD-Na has replaced original MELD for waiting list allocation since January 2016.
Why Sodium Matters
Hyponatraemia in cirrhosis is not simply a laboratory abnormality — it reflects severe circulatory dysfunction and advanced portal hypertension. It develops because arterial underfilling activates the renin-angiotensin-aldosterone system (RAAS), the sympathetic nervous system, and antidiuretic hormone (ADH), leading to water retention that exceeds sodium retention and producing dilutional hyponatraemia.
As a result, a low sodium in a patient with cirrhosis signals a failing compensatory response to the haemodynamic consequences of portal hypertension — not just an electrolyte imbalance. This is why MELD-Na predicts mortality more accurately than MELD alone, and why hyponatraemic patients are appropriately assigned higher scores on the transplant waiting list.
MELD-Na is the current standard for transplant allocation in the US (since 2016). The original MELD formula is still used for other clinical purposes. Know that sodium was added to improve prognostic accuracy, and that hyponatraemia in cirrhosis worsens prognosis beyond what MELD alone captures.
MELD vs Child-Pugh
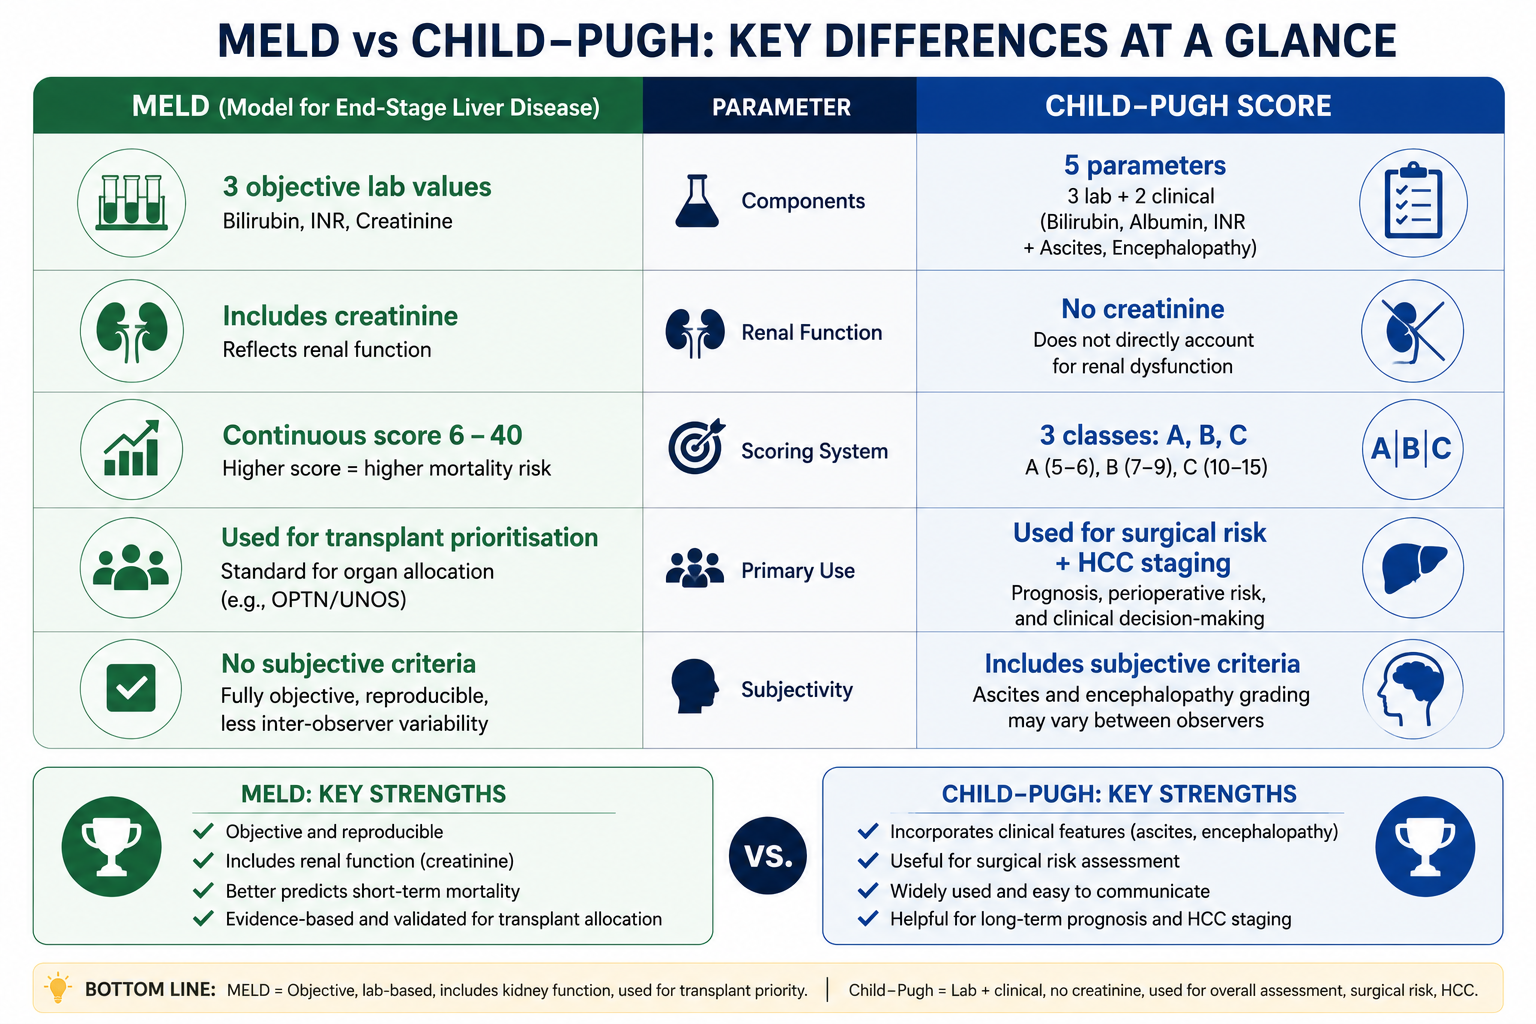
| Feature | MELD | Child-Pugh |
|---|---|---|
| Variables | Bilirubin, INR, Creatinine | Bilirubin, Albumin, INR, Ascites, Encephalopathy |
| Objective? | Yes — all lab values | Partly — ascites and HE are subjective |
| Includes renal function? | Yes (creatinine) | No |
| Score range | 6 to ~40 (continuous) | 5–15 (three classes: A/B/C) |
| Primary use | Transplant prioritisation, mortality prediction | Clinical staging, surgical risk, HCC staging |
| Better for transplant listing? | Yes — more objective, validated | No — superseded by MELD for this |
| Better for communication? | Less intuitive — a number | More intuitive — Class A/B/C language widely used |
| Subjective parameters? | None | Yes (ascites, HE) |
| Used in HCC staging? | Indirectly via exception points | Yes — BCLC uses Child-Pugh class |
In practice, both scores are used — MELD for transplant listing and mortality prediction, Child-Pugh for clinical communication and surgical/procedural risk stratification. They are complementary, not competing. A patient assessed in a liver clinic will often have both scores documented.
Limitations of MELD
MELD does not include ascites, variceal haemorrhage, or encephalopathy. A patient with recurrent variceal bleeding or refractory ascites may have a relatively low MELD yet have a very poor prognosis. This is one reason MELD exception points are granted in certain conditions.
Serum creatinine is affected by muscle mass, age, sex, and medication. In malnourished patients with cirrhosis (who have low muscle mass), creatinine may be falsely low — underestimating renal impairment and MELD score. Cystatin C is a more accurate marker of GFR in this population but is not used in the standard MELD formula.
MELD was developed for chronic liver disease. In acute liver failure (ALF), other scores such as King's College Criteria or the ALFSG Prognostic Index are more appropriate prognostic tools. MELD is frequently used in ALF in clinical practice but was not validated for this indication.
Patients with hepatocellular carcinoma (HCC) within transplant criteria (e.g. Milan criteria) may have well-preserved liver function and a low MELD, yet still face a significant risk of tumour progression rendering them untransplantable. They receive MELD exception points to increase their waitlist priority — but the optimal exception point allocation remains debated.
Exam Tips
- MELD formula: 3.78×ln[Bili] + 11.2×ln[INR] + 9.57×ln[Cr] + 6.43 — know the three variables and their approximate weighting.
- All values in mg/dL; minimum value = 1.0; max creatinine = 4.0 mg/dL.
- INR has the highest coefficient (11.2) — it is the most weighted predictor of mortality in the MELD model.
- MELD includes creatinine; Child-Pugh does not — this is the key structural difference between the two scoring systems.
- MELD-Na adds serum sodium — adopted by UNOS in 2016 for transplant allocation. Hyponatraemia worsens prognosis beyond what MELD alone captures.
- MELD > 15 or > 18 = generally used as a threshold above which the benefits of transplant are likely to outweigh risks.
- Higher MELD = higher position on the transplant waiting list — MELD replaced time-on-list as the allocation basis.
- MELD predicts 3-month mortality without transplant — not survival after transplant.
Frequently Asked Questions
Key Takeaways
- MELD = 3.78×ln[Bili mg/dL] + 11.2×ln[INR] + 9.57×ln[Creatinine mg/dL] + 6.43
- All variables floored at 1.0; creatinine capped at 4.0 mg/dL; final score rounded to nearest integer
- Three variables: bilirubin (excretory function), INR (synthetic function), creatinine (renal function)
- INR has the highest coefficient (11.2) — the strongest mortality predictor in the model
- MELD predicts 3-month mortality without liver transplantation
- Higher MELD = higher position on the transplant waiting list
- MELD-Na adds sodium (adopted by UNOS 2016) — hyponatraemia worsens prognosis beyond MELD alone
- MELD vs Child-Pugh: MELD is fully objective and includes renal function; Child-Pugh is simpler and includes clinical features (ascites, HE)
- Minimum MELD = 6; values ≥ 40 carry ~71% 3-month mortality without transplant
References
- Kamath PS, Wiesner RH, Malinchoc M, et al. A model to predict survival in patients with end-stage liver disease. Hepatology. 2001;33(2):464–470.
- Wiesner RH, McDiarmid SV, Kamath PS, et al. MELD and PELD: application of survival models to liver allocation. Liver Transpl. 2001;7(7):567–580.
- Kim WR, Biggins SW, Kremers WK, et al. Hyponatremia and mortality among patients on the liver-transplant waiting list. N Engl J Med. 2008;359(10):1018–1026.
- Durand F, Valla D. Assessment of the prognosis of cirrhosis: Child-Pugh versus MELD. J Hepatol. 2005;42(Suppl 1):S100–S107.
- European Association for the Study of the Liver. EASL Clinical Practice Guidelines for the management of patients with decompensated cirrhosis. J Hepatol. 2018;69(2):406–460.
- Kim WR, Mannalithara A, Heimbach JK, et al. MELD 3.0: the Model for End-Stage Liver Disease updated for the modern era. Gastroenterology. 2021;161(6):1887–1895.
This article is intended for medical education only. It is designed for medical students, intern doctors, and junior doctors and does not constitute clinical advice. Always refer to current local guidelines and specialist hepatological input when assessing and managing patients with liver disease or evaluating them for transplantation.