Potassium is one of the most important electrolytes influencing cardiac electrical activity. Both hypokalemia and hyperkalemia can alter myocardial excitability and conduction, producing characteristic ECG changes and increasing arrhythmia risk.
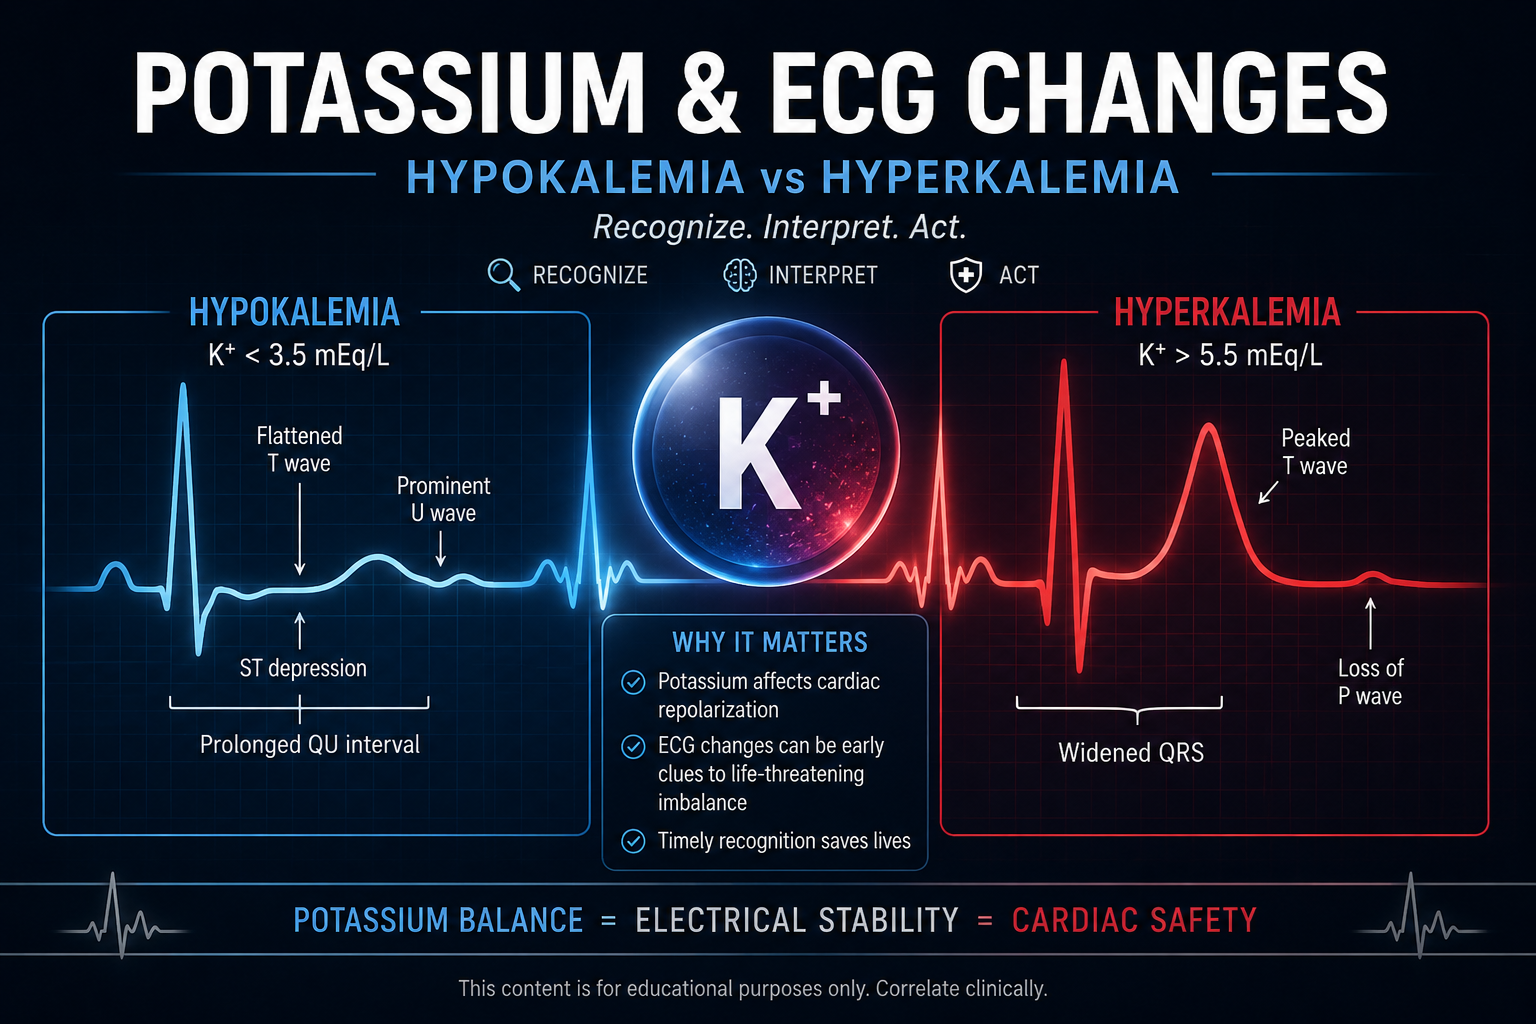
The classic teaching is simple: hypokalemia causes flattened T waves and prominent U waves, while hyperkalemia causes tall peaked T waves and, when severe, QRS widening. The useful question is not only what these patterns are, but why they happen.
This article sits downstream of Electrolytes Explained, Potassium Homeostasis Explained, Hypokalemia Explained, Hyperkalemia Explained and Potassium Replacement Explained.
Serum potassium concentration and ECG severity do not correlate perfectly. The ECG should not replace potassium measurement, and a relatively normal ECG should not be used to dismiss a significantly abnormal potassium result.
Learning Objectives
- Explain why potassium affects cardiac electrical activity
- Recognise principal ECG abnormalities in hypokalemia and hyperkalemia
- Understand U waves, peaked T waves, QRS widening and sine-wave morphology
- Distinguish true QT prolongation from apparent QU prolongation in hypokalemia
- Explain why magnesium deficiency increases hypokalemic arrhythmia risk
- Understand why textbook ECG progressions are teaching models rather than guaranteed sequences
- Integrate ECG findings with potassium level, renal function, acid-base status, medications and symptoms
Potassium ECG Changes at a Glance
Hypokalemia
Flat or inverted T waves, ST depression, prominent U waves, T-U fusion, apparent QT/QU prolongation and arrhythmia risk.
Hyperkalemia
Tall peaked T waves, PR prolongation, P-wave flattening or disappearance, QRS widening, sine-wave pattern and severe conduction disturbance.
These features are pattern-recognition clues, not biochemical measurements. Always correlate them with serum potassium and the clinical situation.
Why Potassium Affects the ECG
Potassium is the major intracellular cation. The concentration of potassium is much higher inside cells than in the extracellular fluid, creating a strong potassium gradient across the cell membrane.
At rest, cardiac cells are relatively permeable to potassium. This makes extracellular potassium a major determinant of resting membrane potential, excitability and recovery after each action potential.
For the foundation behind potassium distribution and cellular regulation, review potassium homeostasis.
Cardiac Action Potential Background
The ECG is not a direct tracing of a single cardiac cell, but action-potential physiology explains why potassium disorders change surface ECG morphology.
| Cellular Event | Main ECG Relationship |
|---|---|
| Atrial depolarisation | P wave |
| AV conduction | PR interval |
| Ventricular depolarisation | QRS complex |
| Ventricular repolarisation | ST segment and T wave |
| Delayed repolarisation phenomena | T-U abnormalities may appear |
Phase 0 depends mainly on fast sodium entry and strongly influences conduction velocity. Phase 3 repolarisation depends heavily on outward potassium currents. Phase 4 is the resting state, where potassium conductance strongly influences membrane potential.
Because potassium currents are major contributors to ventricular repolarisation, potassium disorders often produce prominent T-wave changes. As disturbances become more severe, they can also affect excitability and conduction, especially in severe hyperkalemia.
Why ECG Findings Vary
The same potassium value can produce different ECG appearances in different patients. Important modifiers include:
- Rate of potassium change
- Chronicity of the abnormality
- Calcium and magnesium status
- Acid-base status and potassium shifts, discussed in acid-base disorders
- Kidney function
- Medications affecting potassium balance or conduction
- Underlying structural heart disease or conduction disease
Interpret potassium ECG changes using the patient, potassium concentration, ECG, rate of change, renal function, acid-base status, medications and associated electrolyte abnormalities together.
ECG Changes in Hypokalemia
ECG changes in hypokalemia commonly include decreased T-wave amplitude, T-wave flattening or inversion, ST depression, prominent U waves, T-U fusion, apparent QT or QU prolongation and atrial or ventricular arrhythmias.
Hypokalemia alters myocardial repolarisation and increases susceptibility to electrical instability. ECG abnormalities become more likely as hypokalemia becomes more severe, but no single potassium threshold guarantees a particular ECG pattern.

T-Wave Flattening
One of the early recognised ECG manifestations of hypokalemia is reduced T-wave amplitude. The T wave may become flattened or inverted because ventricular repolarisation is altered.
ST-Segment Depression
Hypokalemia can produce ST depression, often with T-wave flattening and prominent U waves. ST depression is not specific for hypokalemia and must be differentiated from myocardial ischaemia, medication effects, ventricular hypertrophy and other repolarisation abnormalities.
Prominent U Waves
Prominent U waves are classically associated with hypokalemia. A U wave is a small deflection after the T wave, often best seen in the precordial leads. Small U waves may be normal, especially at slower heart rates, but larger U waves should prompt consideration of hypokalemia in the right context.
Why U Waves Occur
The exact electrophysiological origin of the U wave remains incompletely established. Proposed mechanisms include delayed repolarisation involving Purkinje fibres, mid-myocardial cells or other ventricular myocardial regions. For clinical learning, the key point is that prominent U waves are strongly associated with hypokalemia but are not specific.
QT Versus QU Prolongation
In significant hypokalemia, the T wave may flatten while the U wave becomes prominent. The T and U waves can merge, producing T-U fusion and a long combined repolarisation complex.
Hypokalemia may produce apparent QT prolongation because prominent U waves merge with the T wave. Think about T-U fusion and QU prolongation rather than simply measuring the end of the combined complex as the QT interval.
Hypokalemia and Arrhythmias
Hypokalemia may cause premature atrial complexes, premature ventricular complexes, atrial tachyarrhythmias, ventricular tachycardia, ventricular fibrillation and polymorphic ventricular arrhythmias in susceptible patients.
Why Hypomagnesemia Matters
Hypomagnesemia often accompanies hypokalemia. It matters because it promotes renal potassium wasting and increases arrhythmia risk. Hypokalemia with hypomagnesemia is especially important in patients with structural heart disease, myocardial ischaemia, digoxin exposure, QT-prolonging drugs or other proarrhythmic conditions.
ECG Changes in Hyperkalemia
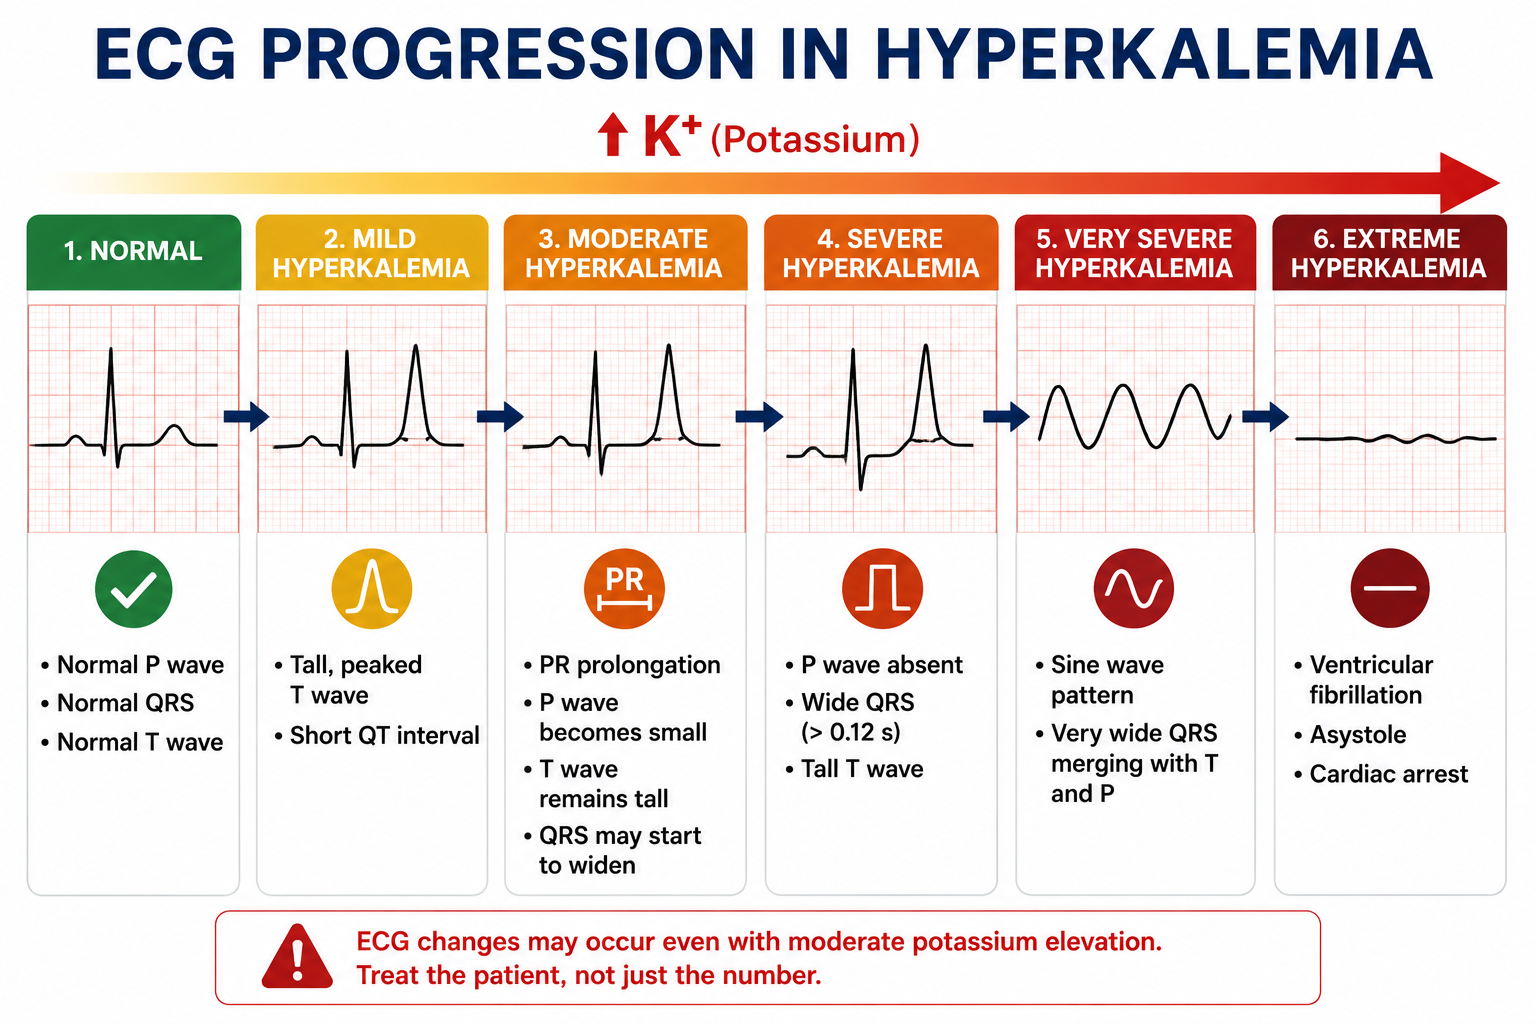
ECG changes in hyperkalemia may include tall peaked T waves, PR prolongation, P-wave flattening or disappearance, QRS widening, sine-wave morphology, bradyarrhythmias, ventricular fibrillation or asystole.
Hyperkalemia initially affects repolarisation but, when severe, progressively impairs excitability and conduction. This is why hyperkalemia can rapidly become a life-threatening cardiac emergency.
Peaked T Waves
Tall, narrow, symmetrical peaked T waves are the classic ECG association of hyperkalemia. They reflect altered ventricular repolarisation, but peaked T waves are not diagnostic by themselves and may be confused with other causes such as early repolarisation or myocardial ischaemia.
PR Prolongation
As hyperkalemia affects conduction tissue, the PR interval may lengthen. This reflects slowed atrioventricular conduction and is more concerning when combined with P-wave attenuation, bradycardia or QRS widening.
P-Wave Flattening and Disappearance
Progressive hyperkalemia may flatten or eliminate visible P waves. A small or absent P wave in a patient with suspected hyperkalemia should be interpreted as a marker of conduction system involvement, not as an isolated curiosity.
QRS Widening
QRS widening is a dangerous ECG feature in hyperkalemia. It suggests impaired ventricular depolarisation and slowed conduction.
Why Severe Hyperkalemia Slows Conduction
Severe hyperkalemia causes persistent membrane depolarisation, reduces fast sodium-channel availability, slows phase-0 depolarisation and slows ventricular conduction. This produces QRS widening and increases the risk of malignant arrhythmias.
Sine-Wave Pattern
In very severe hyperkalemia, the widened QRS and T wave may merge into a sine-wave morphology. This pattern indicates severe cardiotoxicity and requires urgent clinical assessment. It should not be assumed that every patient progresses through all classic stages before arrest.
Bradyarrhythmias and Arrest
Severe hyperkalemia can cause bradycardia, high-grade conduction block, ventricular fibrillation, asystole and pulseless electrical activity. Treatment principles are covered in the dedicated potassium replacement and safety article and local emergency protocols.
Hypokalemia Versus Hyperkalemia ECG Changes
| Feature | Hypokalemia | Hyperkalemia |
|---|---|---|
| T wave | Flattened or inverted | Tall, narrow, peaked |
| U wave | Prominent U waves, T-U fusion | Not a typical feature |
| ST segment | ST depression may occur | Usually not the main teaching feature |
| PR/P wave | May show conduction effects in severe cases | PR prolongation, P-wave flattening or loss |
| QRS | Usually not widened from hypokalemia alone | QRS widening is a dangerous feature |
| Severe pattern | Ventricular ectopy, VT, VF, torsades in susceptible contexts | Sine-wave pattern, VF, asystole, cardiac arrest |
Practical ECG Approach
When interpreting a potassium-related ECG, ask: Is the potassium abnormality real? Is the ECG compatible? Are there dangerous features? Is the patient symptomatic? Could another diagnosis explain the ECG?
When Are Potassium ECG Changes Dangerous?
Danger increases when ECG abnormalities are associated with symptoms, severe potassium derangement, rapid potassium change, renal failure, structural heart disease, digoxin exposure, QT-prolonging medications, hypomagnesemia or significant acid-base disturbance.
- Ventricular ectopy or ventricular tachycardia in hypokalemia
- Marked T-U fusion with apparent QU prolongation
- Hyperkalemia with QRS widening
- P-wave loss, bradycardia or high-grade conduction block in hyperkalemia
- Sine-wave morphology
- Syncope, hypotension, cardiac arrest or severe weakness with any potassium abnormality
Why a Normal ECG Does Not Exclude Severe Hyperkalemia
Yes, severe hyperkalemia can occur with a relatively normal ECG. Studies show that ECG interpretation is not sensitive enough to rule out hyperkalemia. Therefore, a normal or near-normal ECG should not reassure clinicians when the potassium result or clinical setting suggests danger.
A normal ECG does not exclude dangerous hyperkalemia. Treat the ECG as a toxicity assessment tool, not as a screening test that replaces serum potassium measurement.
Differential Diagnosis of Key Patterns
Peaked T Waves
Peaked T waves may occur with hyperkalemia, early repolarisation, acute myocardial ischaemia, left ventricular hypertrophy and normal variants. Hyperkalemia is more likely when peaked T waves are narrow, symmetrical, diffuse and clinically supported by renal failure, potassium-retaining drugs or a high potassium result.
U Waves
U waves may be seen with hypokalemia, bradycardia, some antiarrhythmic drugs, ventricular hypertrophy and other repolarisation states. Prominent U waves are a strong clue to hypokalemia but are not specific.
Common Mistakes
- Assuming ECG changes always progress in a fixed order
- Using a normal ECG to rule out severe hyperkalemia
- Calling every tall T wave hyperkalemia without clinical correlation
- Assuming U waves occur only in hypokalemia
- Measuring T-U fusion as true QT prolongation without considering QU prolongation
- Ignoring magnesium in hypokalemic arrhythmia risk
- Duplicating treatment decisions without checking local emergency protocols
Clinical Examples
Example 1: Diarrhoea and Weakness
A patient with prolonged diarrhoea has weakness, potassium of 2.7 mmol/L, flattened T waves and prominent U waves. The ECG supports clinically important hypokalemia, but management still requires cause correction, magnesium assessment and monitoring.
Example 2: CKD and Peaked T Waves
A patient with advanced CKD presents with potassium of 6.8 mmol/L and tall peaked T waves. This combination is concerning for hyperkalemic cardiotoxicity and requires urgent clinical assessment according to local protocols.
Example 3: Severe Hyperkalemia With Few ECG Changes
A patient on dialysis has potassium of 7.0 mmol/L but only subtle ECG changes. The ECG does not exclude danger; the potassium value, renal context and clinical picture remain high-risk.
One Minute Revision
- Potassium alters resting membrane potential, repolarisation, excitability and conduction.
- Hypokalemia commonly causes flat T waves, ST depression, prominent U waves and apparent QT/QU prolongation.
- Hyperkalemia commonly causes peaked T waves and may progress to PR prolongation, P-wave loss, QRS widening and sine-wave morphology.
- The classic hyperkalemia ECG progression is a teaching model, not a guaranteed sequence.
- A relatively normal ECG does not exclude severe hyperkalemia.
- Peaked T waves and U waves require clinical and biochemical correlation.
- Magnesium deficiency increases hypokalemic arrhythmia risk and makes potassium correction harder.
Frequently Asked Questions
Conclusion
ECG changes in potassium disorders are best understood through physiology rather than memorised as disconnected signs. Hypokalemia primarily produces repolarisation abnormalities such as T-wave flattening, U waves and T-U fusion, while severe hyperkalemia can impair conduction and produce QRS widening, sine-wave morphology and cardiac arrest. The ECG is clinically vital, but it is not a potassium meter. Safe interpretation requires serum potassium, symptoms, renal function, acid-base status, medications and associated electrolyte abnormalities to be considered together.
This article is intended for medical education only. Potassium disorders can be life-threatening and require patient-specific clinical assessment, ECG review, laboratory confirmation, local emergency protocols and senior or specialist input when appropriate.